Webinar 4. Interpreting Data and Making Decisions
This module has been developed with the following framework:
- Identifying when instructional change is recommended.
- How to use CBM/progress monitoring data to develop IEP goals and objectives.
Graphing student progress
Communicating and interpreting student scores in CBM progress monitoring can be done easily through graphing student progress
Ann's maze scores
The graph is a convenient performance record that is easily understood. Many progress monitoring programs have automatic graphing tools available.
Steps for graphing manually are:
- Label a graph for each student
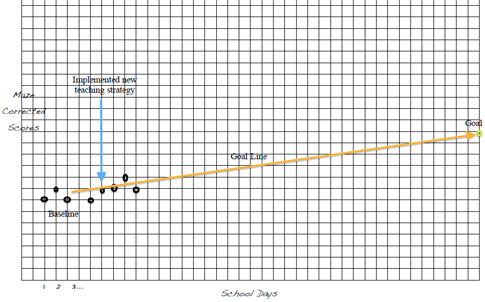
- The bottom or horizontal axis in the graph is labeled “school days” and the graph paper is divided into five-day school weeks.
- The left side, or vertical axis of the graph should read “Maze Corrected Scores” or “ Writing CWS Scores”
- After the labels are completed, place a dot on the graph that represents the student’s baseline performance. The baseline should include three to six data points.
- Calculate the rate of expected weekly or monthly growth from the baseline to the end of the year or the last day of progress monitoring (e.g. 2 CWS/ week; .5 C-I Maze/ week)
- Place a dot on the last day of monitoring progress – this will represent the student’s end-of-year goal. Draw a line from the baseline dot to the goal dot. This line is the student’s aimline or goal line.
- Add a dot to the appropriate spot each time you conduct progress monitoring. If a student is absent on the day of regularly scheduled progress monitoring, do not record anything on the graph. If the student was absent for only one session, a straight line can connect the last dot to the next dot. However, if the student is absent for more than one consecutive session, the data points should not be connected and there will be a gap in the line graph.
- Finally, notes about any instructional change (new teaching strategies, different curriculum materials, etc) should be recorded on the graph. A straight vertical line on the graph will reflect the time point that the instructional change went into effect. This will assist in the decision making process.
Timmy Jones' reading graph